Apollo.io Features & Comparisons: CRM Overview for 2026
Apollo.io is a CRM solution designed to help small businesses streamline sales processes, customer relationship management, and lead generation.
Here's a brutal truth: Every time a skilled employee walks out the door, you lose more than just talent—you lose knowledge, momentum, and money.

Apollo.io is a CRM solution designed to help small businesses streamline sales processes, customer relationship management, and lead generation.
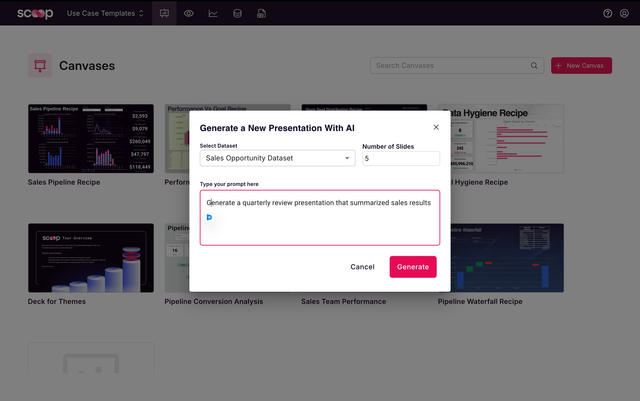
We’re excited to introduce a major update to the Scoop platform: an AI-powered feature that turns data into comprehensive presentations and reports, designed to communicate insights clearly and efficiently. This isn’t just about automating charts—it’s about creating a cohesive story that connects ke
Can AI actually predict which customers will churn next month and tell you exactly what to do about it? Yes—and it's happening right now through agentic analytics, transforming how businesses move from reactive reporting to proactive decision-making. Unlike traditional analytics that simply shows yo
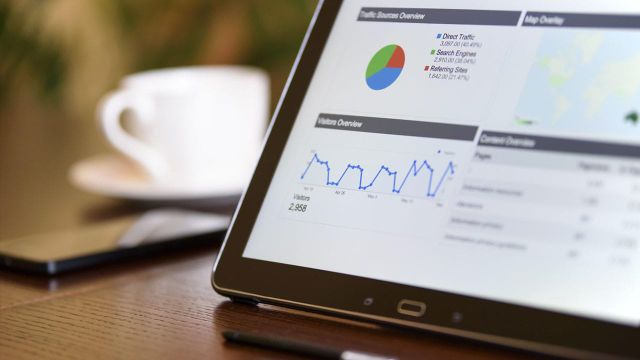
For operations professionals in revenue, marketing, sales, finance, and customer management, making sense of ever-changing data can feel like trying to hit a moving target. Traditional reporting tools often lack the depth needed to capture dynamic data trends and provide actionable insights.
What is healthcare analytics? It’s more than just data—it’s the engine driving safer patient care and smarter hospital operations. This guide explores how turning raw numbers into actionable insights can reduce waste, improve outcomes, and empower leaders to solve problems before they even happen.
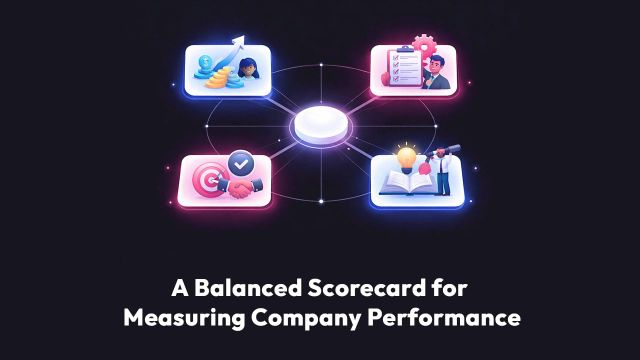
A balanced scorecard for measuring company performance is a strategic management tool that translates your vision and strategy into measurable objectives across four perspectives: financial results, customer value, internal processes, and learning and growth. Unlike traditional financial-only metric
In the ever-changing landscape of business, finding the ideal pricing strategy can be a perplexing task. However, the advent of analytics has opened up a multitude of possibilities for businesses to achieve pricing optimization. By harnessing the power of data, companies can make informed decisions
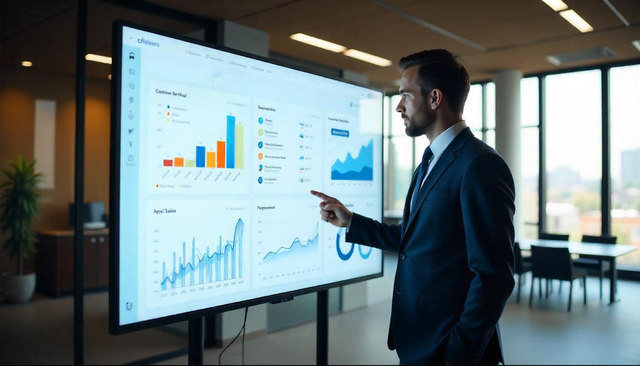
Data is your secret weapon. But let’s be honest—most dashboards are overwhelming, cluttered, and fail to drive action. You’ve probably stared at a BI dashboard filled with dozens of metrics, wondering, What am I supposed to do with this?
This week I sat in on a demo with a growth lead at a consumer mobile app company. About ten minutes in, almost as an aside, he said something that I keep coming back to:
Every operations leader knows the frustration of staring at a red-lining KPI without knowing how to fix it. To bridge that gap, you first have to understand what is a data dashboard in today's landscape: is it just a static graveyard for numbers, or is it a launchpad for autonomous investigation? At
In today’s fast-paced operational environment, simply having access to information isn’t enough; you need a way to synthesize it instantly. This guide explores the fundamental question—what is a data dashboard—and reveals why traditional visualizations often fail the "last mile" of business intellig
What is data reconciliation? It's the process that keeps your business data accurate across systems: comparing datasets to catch discrepancies before they become costly errors. For operations leaders, it's the difference between confident decisions and expensive mistakes that ripple through every de
When it comes to business intelligence (BI), Power BI is often one of the first tools that comes to mind. Microsoft’s widely adopted analytics platform promises to help organizations transform raw data into actionable insights. It’s powerful, flexible, and integrates seamlessly with other Microsoft
In today’s business world, data is everywhere—but understanding it is another story. Exploratory data analysis (EDA) bridges that gap. It’s the process that turns raw numbers into meaningful insights you can actually act on.
What are trend analysis? Trend analysis is the systematic examination of data patterns over time to identify directional movements, predict future outcomes, and inform strategic decisions. By analyzing historical data, businesses can spot upward trends, downward shifts, or stable patterns that revea
In the fast-paced world of SaaS, aligning sales, marketing, and operations isn’t just a strategy—it’s a necessity.
Data presentations have evolved, and the Scoop Analytics integration with Canva takes them to a new level.