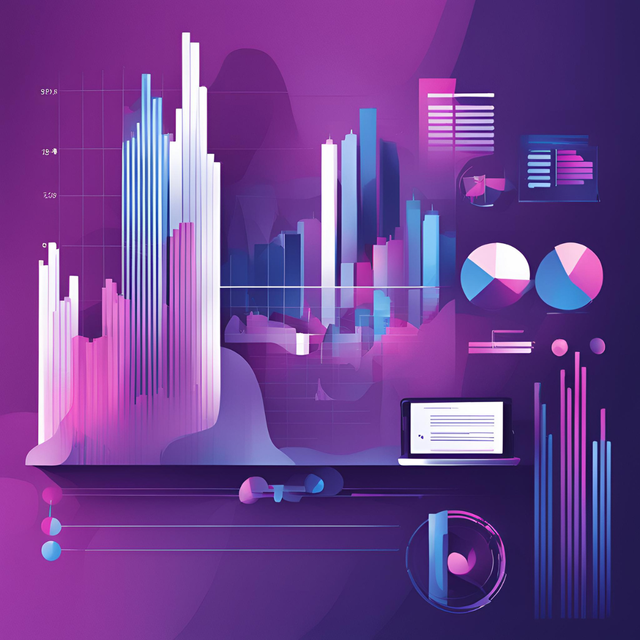
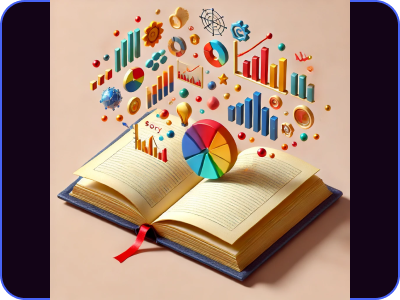
What is Data Storytelling & How to Use It Effectively
Data storytelling can change the way you get things done—and it’s not as intimidating as it seems. Here’s a practical guide to mastering data storytelling in your business.
Business intelligence (BI) was supposed to make decision-making easier, yet for most companies, it has become a technical burden. Tools like Power BI and Tableau require data engineers, SQL queries, and weeks of setup just to produce reports—turning BI into an IT-driven process instead of a business
When you’re in charge of keeping a business running smoothly—whether in revenue ops, marketing ops, or sales ops—data isn’t just part of your job. It is your job. You’re constantly tracking KPIs, trying to piece together performance stories, and answering critical questions like “What’s working? Wha
Turning data into insights and delivering those insights in a compelling way shouldn’t be a struggle. For teams in sales, marketing, finance, and operations, building data-driven presentations often feels like a slog. Scoop changes that, giving you the tools to create AI-powered BI presentations tha
Whether you’re in revenue ops, marketing ops, sales ops, finance ops, or customer ops—understanding how your processes flow is critical. It's not enough to know where you started or where you ended up; you need to understand the journey. This is where Sankey diagrams in Scoop become a game-changer.
Marketers often juggle two competing realities: the need for fast, responsive campaigns, and the slow, fragmented process of gathering insights to inform those campaigns. Somewhere between spreadsheets, dashboards, and analytics tools, time gets lost—and so do opportunities. But what if accessing da
A pie chart is one of the most widely used methods for presenting a visual representation of data, allowing viewers to quickly grasp proportions within a dataset. When using a visual representation generator, ensuring accuracy and clarity is essential. A misleading or poorly designed chart can cause
Building a complete picture of your customer’s journey is about more than just tracking numbers—it's about truly understanding what drives their success. A Customer 360 view consolidates every interaction, every touchpoint, and every piece of data, helping your team connect the dots. As we’ve learne
For operations professionals in revenue, marketing, sales, finance, and customer management, making sense of ever-changing data can feel like trying to hit a moving target. Traditional reporting tools often lack the depth needed to capture dynamic data trends and provide actionable insights.
Choosing the right CRM can be a game-changer for your business, especially for operations leaders in revenue, marketing, sales, finance, and customer support roles. A CRM isn't just a tool—it's the foundation for how data flows in and out of your organization. Whether you're looking for robust autom
When we set out to build our marketing stack, I wanted everything centralized in Scoop—from Google Analytics and product behavior data to HubSpot CRM and Google Ads. My plan was to create a Customer Data Platform (CDP) within Scoop that tracks every step of the user journey. That meant pulling produ
"What if you could track the entire customer journey—every touchpoint, every interaction, and every decision—without the massive overhead of a full-blown data warehouse?"
Blending data is a necessity in any business, whether you're in sales and marketing, finance and product development, or customer support. But how do you do it effectively? Are static .csv files the best you can do, or is there a more sophisticated way? Let's dive into the four stages of data blendi
For revenue operations, marketing, sales, finance, and customer operations teams, financial reporting often starts with a familiar yet frustrating process: exporting data from QuickBooks into spreadsheets, manually formatting reports, and then trying to transform those numbers into a compelling pres
Managing and simplifying a data stack is a priority for many modern businesses, particularly for teams in Revenue Ops, Marketing Ops, Sales Ops, Finance Ops, and Customer Ops. Traditionally, optimizing your data stack requires significant investments in complex infrastructure and technical expertise
Data is at the heart of decision-making in today’s organizations, yet presenting it in a meaningful way often feels like a daunting task. For operations teams in sales, marketing, finance, and customer success, creating executive-friendly presentations isn’t just about aesthetics—it’s a strategic ne
Most analytics tools today still depend on people doing all the setup—cleaning data, building dashboards, writing formulas, and interpreting reports.
Cross-department collaboration is essential for modern businesses. Yet, many companies struggle to align sales, marketing, customer service, and other teams due to siloed systems and fragmented data. CRM data integration solves these challenges by uniting data across teams, enabling seamless communi